Logs, monitoring and knowing when it breaks
Read Linkstash's logs through journalctl, watch resource use with real commands, and set up a basic uptime check so you find out about downtime first.

A server that's been quiet for three days feels like a server that's fine. It's not always true, and "I'll check when something looks wrong" only works if something makes it look wrong to you specifically, at the moment it happens. Right now, if Linkstash starts throwing 500s at 2am, the only way you'd know is a user emailing to complain, which is the worst possible monitoring system. This lesson closes that gap: reading the logs you already have, watching the server's health, and getting notified the moment the app stops answering.
Everything is already in journalctl
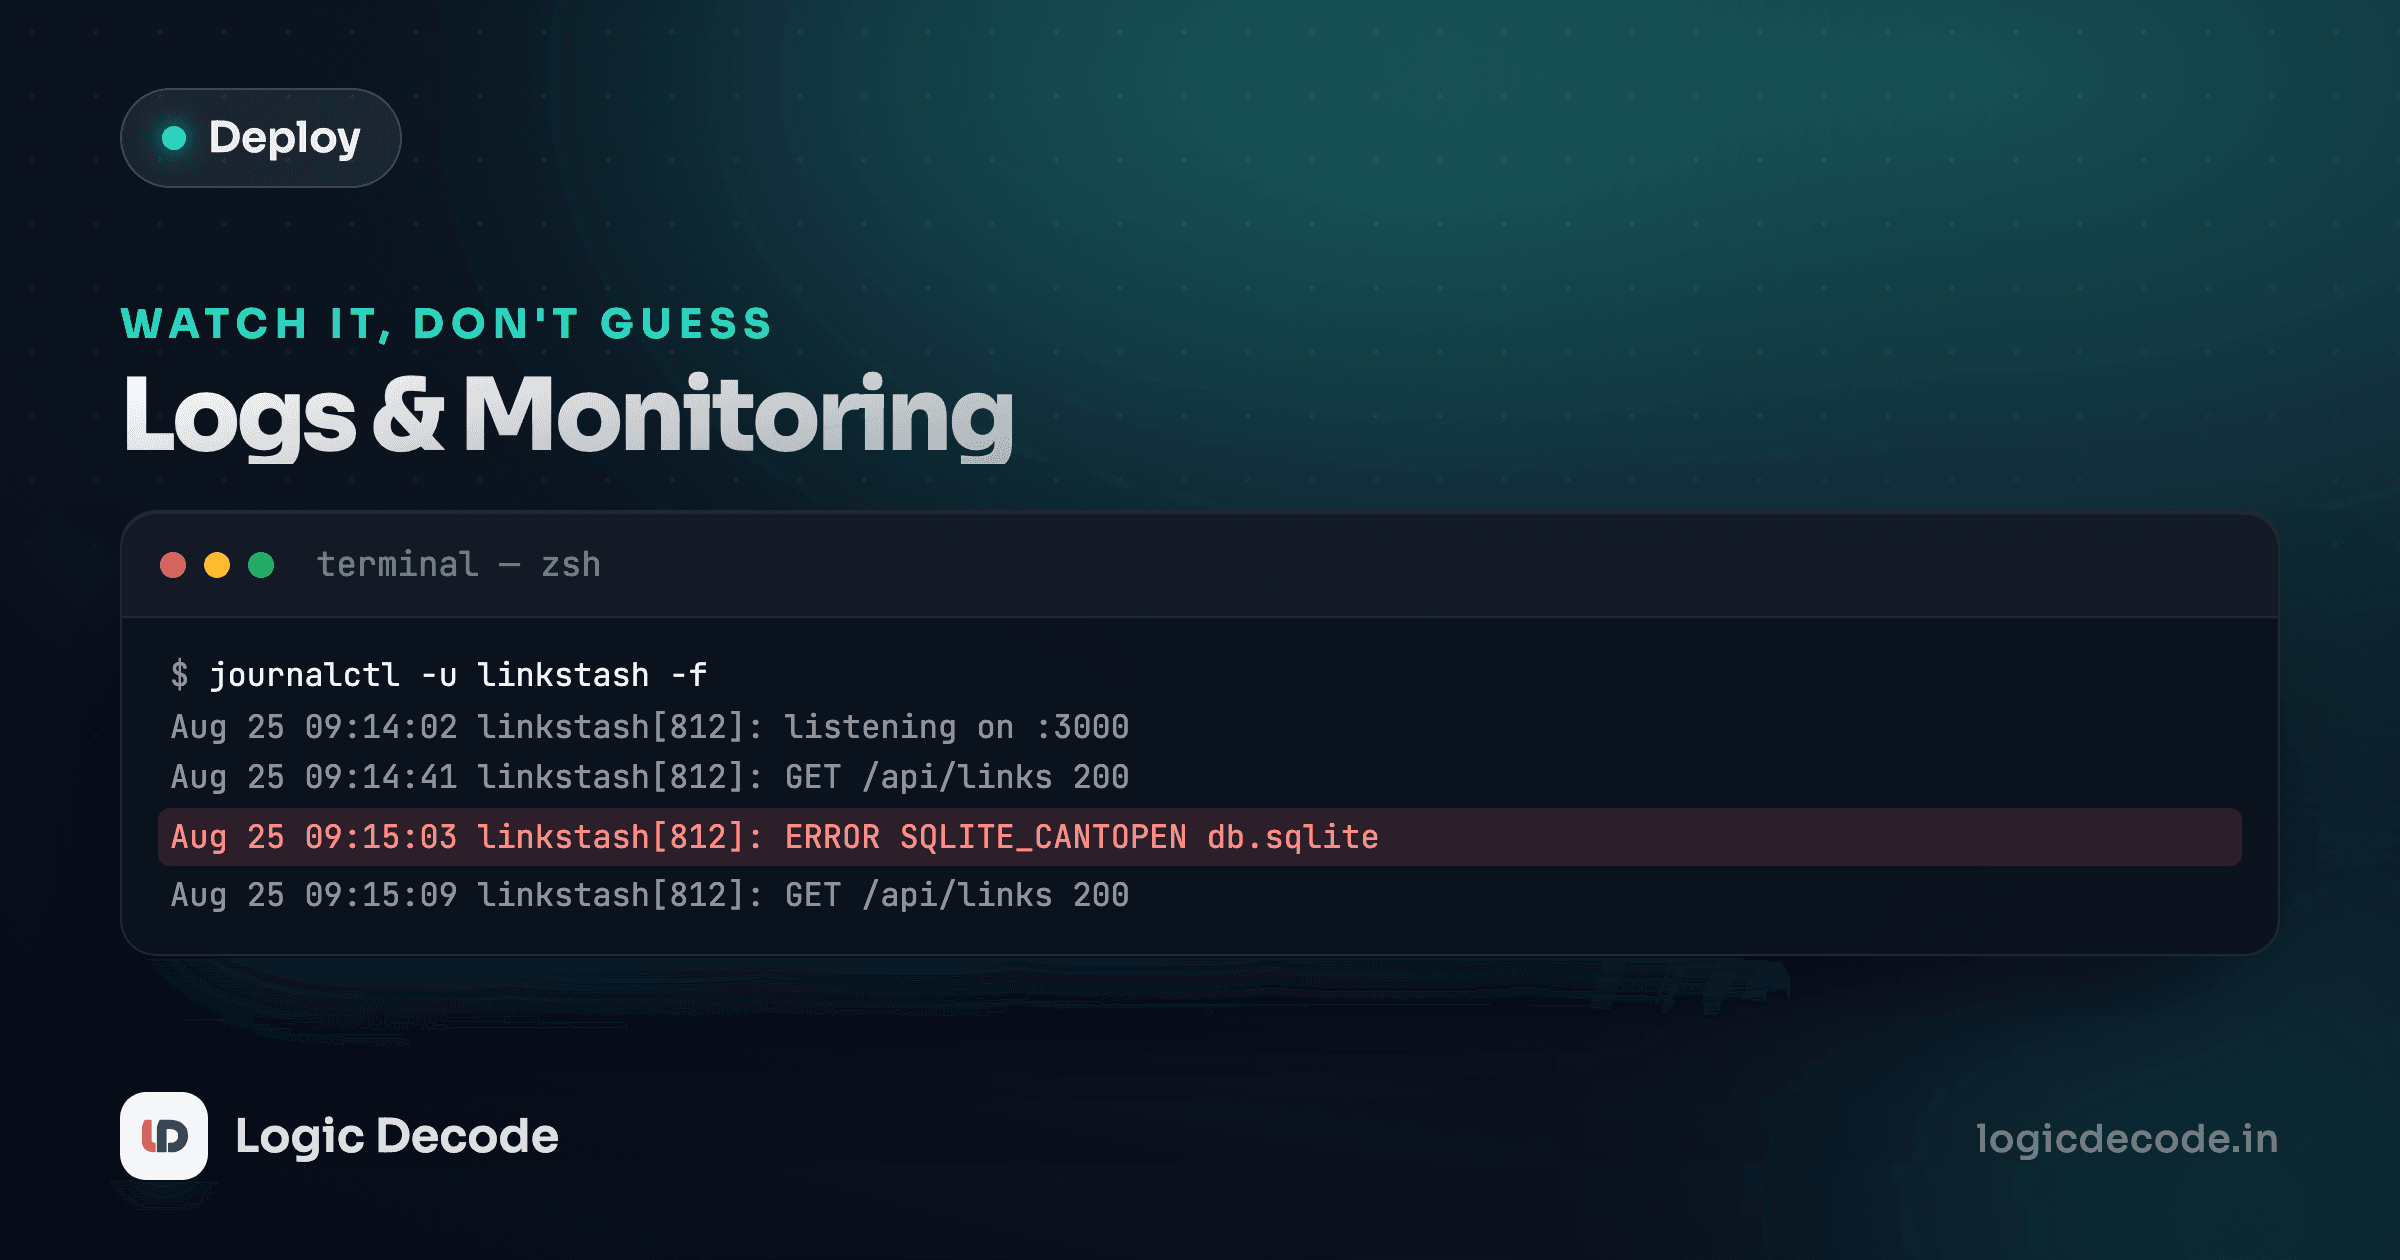
You didn't set up a logging pipeline. You didn't need to. Because Linkstash runs under systemd, every console.log and console.error call it makes, including the deliberate one in its error handler, is already captured and stored:
app.use((err: Error, _req: Request, res: Response, _next: NextFunction) => {
  console.error(err);
  res.status(500).json({ error: "InternalServerError" });
});
That console.error(err) line writes a full stack trace to stderr every time a request throws, and systemd's journal picks it up automatically. You've seen the read side of this before, but it's worth going deeper now that the app is actually live.
journalctl -u linkstash -f-f follows the log live, the same way tail -f would. Leave this running in a spare terminal while you poke the app and watch requests land in real time. To look backward instead of live:
journalctl -u linkstash --since "1 hour ago"
journalctl -u linkstash --since today
journalctl -u linkstash -p err
That last one, -p err, filters to only error-priority lines, which is the fastest way to scan a busy log for the handful of lines that actually matter. If you want to confirm the error path works at all, hitting the app's deliberate failure route is the quickest test:
curl -i https://linkstash.example.com/boom
journalctl -u linkstash -n 5 --no-pager
You'll see a 500 come back from curl and the matching stack trace appear in the journal within the same second. That confirms the whole pipe works, errors really do land where you're looking. Keep that fact in mind for the next lesson, because /boom existing on a live server at all is a problem you're about to fix, not a feature to leave running.
Watching resource use
Logs tell you what happened. A separate, simpler set of commands tells you the state the server is in right now. htop (install it with sudo apt install htop if it's not there already) gives you a live, readable view of CPU and memory per process:
htopFind the node process for Linkstash and watch its memory column over a day or two of real traffic. A slow, steady climb that never levels off is the signature of a memory leak, worth investigating before it eventually gets the process killed by the kernel's out-of-memory handler. A number that rises with load and settles back down is normal and expected.
Disk space matters just as much, and it's the more common cause of a server quietly going bad, since a full disk breaks writes to the SQLite database and to the log itself.
df -hFilesystem Size Used Avail Use% Mounted on
/dev/vda1 25G 14G 10G 59% /Check this weekly at minimum until you've got real monitoring in place, and pay attention to what's actually consuming space, since systemd's journal itself grows without bound unless you tell it not to:
journalctl --disk-usage
sudo journalctl --vacuum-time=14d
--vacuum-time=14d trims the journal to the last two weeks, which is usually enough history for debugging without letting logs slowly eat the disk that also holds your database.
Quick check
Why is a slowly, steadily rising memory number for the Node process worth investigating, while one that rises and falls with traffic isn't?
Finding out before your users do
Watching logs manually doesn't scale past the first week. The thing that actually matters is getting told the moment the app stops responding, without you having to go looking. The simplest version of this is an external uptime checker, something like UptimeRobot or a similar service, hitting your live URL on a schedule from outside your server entirely (checking from the server itself only tells you the server thinks it's fine, which isn't the same question).
Point it at a route that proves the whole stack is actually working end to end, not just that Nginx is up:
curl -i https://linkstash.example.com/linksHTTP/1.1 401 UnauthorizedThat 401 is the correct, healthy response for an unauthenticated request, and it's a better health check than pinging / blindly, because it only comes back if DNS resolved, TLS negotiated, Nginx proxied the request, and Linkstash's own auth middleware actually ran. Set the checker to hit this URL every few minutes and alert you by email or text the moment it stops returning 401 and starts returning nothing, a timeout, or a 502.
A 502 from Nginx means something specific
If a health check starts seeing 502 Bad Gateway instead of your app's own responses, that's Nginx telling you it's up but can't reach Linkstash behind it. Check sudo systemctl status linkstash first. Nine times out of ten the app crashed and systemd hasn't restarted it yet, or it's stuck restarting in a crash loop.
You now have three layers of visibility: the journal for what happened and why, resource commands for the server's current state, and an external check for the one thing that actually matters, whether real visitors can reach the app. Next up is the last lesson: ship Linkstash to a live URL, where every piece from this series comes together, including one step you cannot skip before calling it done.

Written by
Rhythm Bhiwani
Engineer and relentless builder, happiest reverse-engineering hard problems until they click.
Enjoyed this?
Tap the heart to leave some love.
Be the first to react
Comments
Join the conversation.
Loading comments…